1.2 Gel times
The gel times (for the different %w/v ammonia solutions) were required to find the optimum %w/v ammonia solution for a gel which sets at a rate sufficient to stabilise the NI3 into the matrix. The faster the setting rate, the more rapid the evolution of ammonia from the gel, the less likely that the NI3 will remain stable long enough to be kept stable in the agar.
The gel time of an agar solution can be found by making up the gel and pouring it into a boiling tube. The boiling tube is placed in a thermostat, set at room temperature. The reason for setting the thermostat at room temperature is to negate the influence of draughts and the effect of bubbling nitrogen through the gel (which would cool the gel faster than it would without the passage of nitrogen through the setting gel).
A fine drawn glass pipette is inserted into the gel (this can be the gel without ammonia or with ammonia) so that the end is close to the bottom of the tube. Nitrogen gas is introduced at a fixed rate of so many c.c. min-1. The gel time is taken when the bubble fails to break the surface. At this point, the last bubble will come out of the pipette and become deformed, staying static. A graph of time for bubble rise vs. temperature of the gel can be drawn.
Graphs of varied ammonia-to-water content were drawn in the following way : the first run was 100% water and the water content then was decreased in 5% steps and the ammonia increased by the same amount until the 0.880 S.G. ammonia concentration was 100%.
The actual concentration may be calculated from the known content of 0.880 S.G. ammonia if required.
0.880 S.G. ammonia contains 31% w/v ammonia. That is to say, for every 100 cm3 of 0.880 S.G. ammonia, 31cm3 is ammonia with 69 cm3 being water.
"5% ammonia" is 5 cm3 of 0.880 S.G. ammonia to 95 cm3 water.
By use of the formula

the actual percentage of ammonia in the agar can be determined. However, it is simpler to consider the 5% as 5% and not 5% of 31% of 100%.
The results and graphs are as follows.
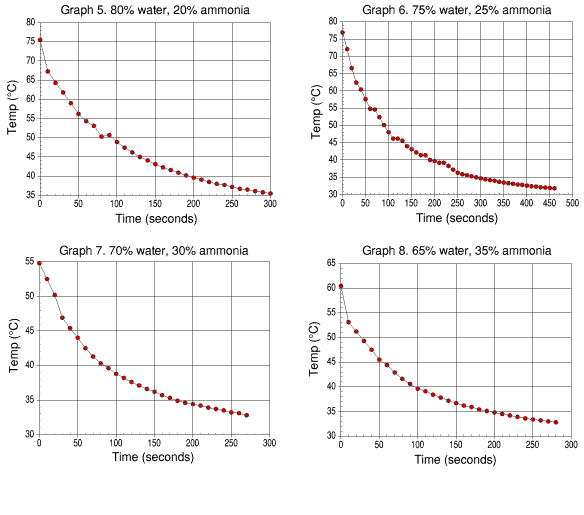
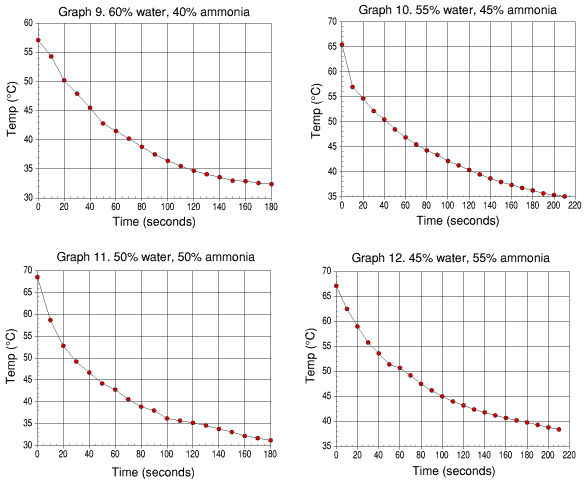
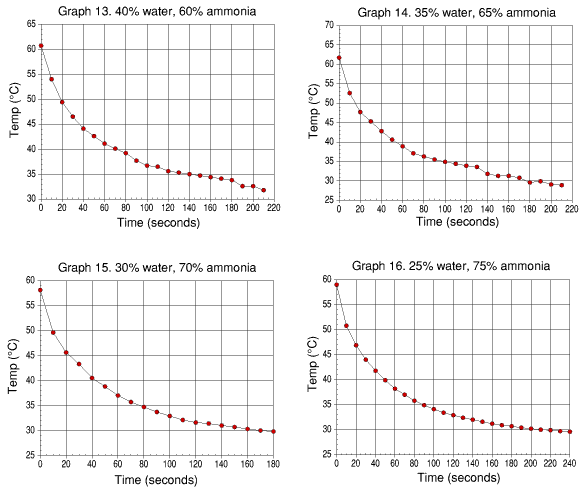
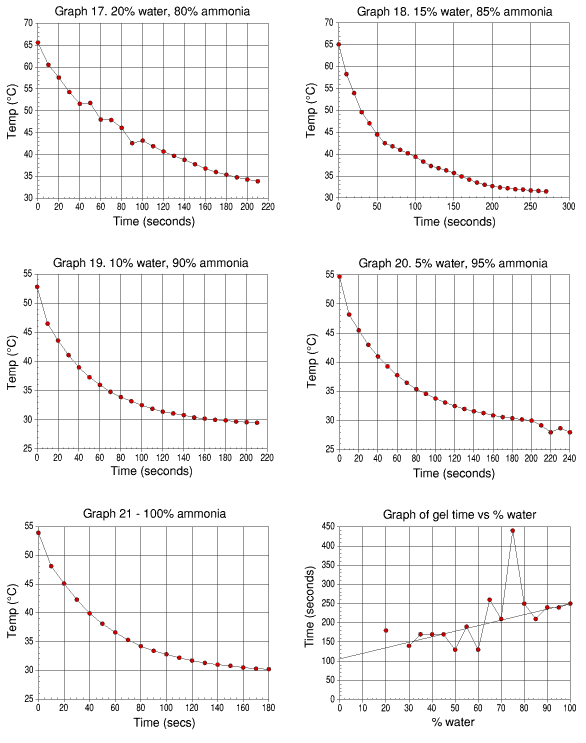
The graphs were obtained by recording the temperature every 10 seconds and timing how long a single bubble of nitrogen took to rise from the pipette to the surface of the gel.
| % water | % ammonia | Gel time (secs) | Gel temp | % ammonia (w/v) |
| 100 | 0 | 250 | 37.6 | 0.00 |
| 95 | 5 | 240 | 37.6 | 1.55 |
| 90 | 10 | 240 | 37.7 | 3.10 |
| 85 | 15 | 210 | 36.2 | 4.65 |
| 80 | 20 | 250 | 37.2 | 6.20 |
| 75 | 25 | 440 | 32.0 | 7.75 |
| 70 | 30 | 210 | 34.2 | 9.30 |
| 65 | 35 | 260 | 33.2 | 10.85 |
| 60 | 40 | 130 | 34.1 | 12.40 |
| 55 | 45 | 190 | 35.7 | 13.95 |
| 50 | 50 | 130 | 34.6 | 15.50 |
| 45 | 55 | 170 | 40.2 | 17.05 |
| 40 | 60 | 170 | 34.1 | 18.60 |
| 35 | 65 | 170 | 32.5 | 20.15 |
| 30 | 70 | 140 | 31.0 | 21.70 |
| 25 | 75 | no gel | 23.25 | |
| 20 | 80 | 180 | 35.4 | 24.80 |
| 15 | 85 | no gel | 26.35 | |
| 10 | 90 | no gel | 27.90 | |
| 5 | 95 | no gel | 29.45 | |
| 0 | 100 | no gel | 31.00 | |
| Constant gel = 3g | ||||
| Bath temp = 25°C | ||||
| Total vol = 100 cm3 | ||||
| Gas = nitrogen |
While the results for 75% and upwards ammonia show "no gel" for the time or temperature, gels do form at room temperature but take a number of hours to do so e.g. 100% ammonia - agar takes around 7 hours to form.
The rate at which the gel actually forms gives a convenient method for the keeping of the nitrogen triiodide without explosion. The NI3 when made, requires 0.880 S.G. ammonia present to maintain stability. If the rate of evolution of ammonia from the gel matrix is too rapid, the NI3 detonates. Gel time clearly increases with ammonia content when the content is above 80% ammonia.
NI3 is normally an adduct and has to be kept under 0.880 S.G. ammonia to maintain stability. The NI3 is kept stable by the ammonia already present in the gel, but then as the gel dries, the ammonia evolves from the matrix leaving the NI3. Only NI3 at the very surface is susceptible to explosion.
Graphs of temperature change vs. time for agar gels
These graphs depict the cooling curves of the various water / ammonia agar gels in the thermostat. The actual gel times are given in the table.


The final graph (% water vs. gel time) comes from taking the final bubble time (the real gel time) and plotting it as a graph against time.
The straight line would indicate that the gel time for 100% NH3 (that is 100% of 0.880 S.G.) should be far shorter than that of water, yet from what has been seen before, it quite obviously isn't.
Agar traps the water or ammonia as it dries and over time the structure deteriorates allowing the water or ammonia to be released. The rate at which water is released is far greater than that of the ammonia. This can be verified by making two identical gels, one with just water and the second with 0.880 S.G. ammonia and leaving them on an open bench. The agar made with just ammonia will crumble after 48 hours, while the gel made with water can take weeks to reach the same state of degradation.
A second consideration is that the gel does not use ammonia or water as part of the gel matrix. The gel is held together electrostatically.
With NH3, the agar structure is already positively charged and will therefore electrostatically bond far more readily. The bond breaking will take a far longer time.
